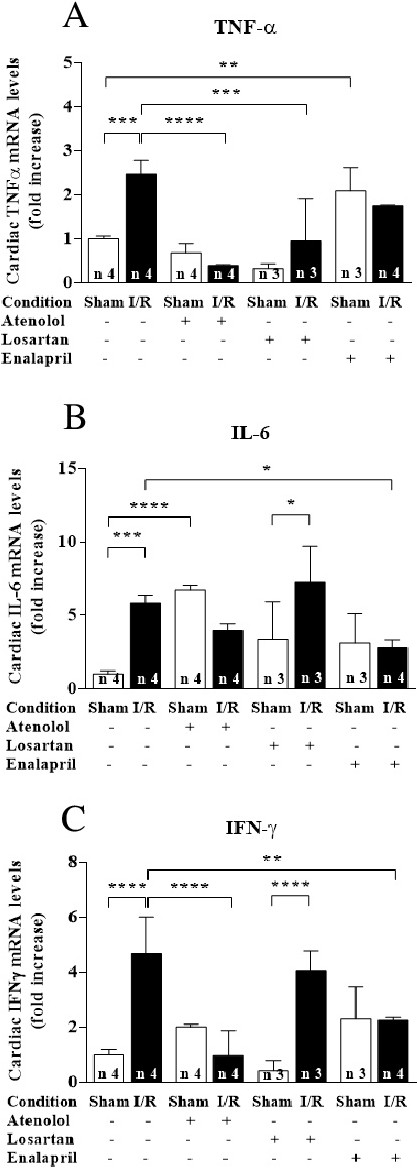
Fig. 9. Inflammatory profile in cardiac tissue after renal I/R. Gene expression for TNF-a, IL-6, and IFN-g was determined in Sham (empty bars) and I/R (filled bars) mice were treated with or without atenolol, losartan, or enalapril, as indicated on the abscissae. (A) TNF-α mRNA. (B) IL-6 mRNA. (C) IFN-γ mRNA. Data are mean ± SD. Differences were assessed using one-factor ANOVA followed by Bonferroni's test for selected pairs. *p<0.05, ** p<0.01, *** p<0.001, **** p<0.0001.